Marketing has never produced more data than it does today.
Every campaign, channel, and platform generates a constant stream of numbers.
Your dashboard is filled with traffic reports, engagement metrics, click-through rates, impressions, followers, conversions, and dozens of other data points.
The challenge isn’t finding data.
The challenge is knowing which numbers actually matter.
Many metrics look impressive in reports but reveal very little about business performance.
For example,
- A post can generate thousands of likes without creating a single customer.
- A website can attract more traffic while revenue stays flat.
- A campaign can produce strong engagement while wasting budget behind the scenes.
When everything looks important, it’s difficult to know what deserves your attention.
The good thing is that you don’t need more reports or more metrics.
You need the right KPIs.
Below, you’ll find the eight marketing KPIs that help you measure what actually drives growth, along with practical ways to track and improve them.
Not every metric deserves a place on your dashboard. The KPIs below will help you focus on the numbers that connect marketing activities to real business results.
As you work through each KPI, consider how it fits into your broader marketing strategy and performance tracking process. If you’re looking to build a more measurable growth system, our Digital Marketing Services team can help you connect your marketing efforts to meaningful business outcomes.
What Is a Marketing KPI?
A marketing KPI (Key Performance Indicator) is a measurable value that shows how effectively your marketing activities contribute to a specific business objective.
In simple terms, a KPI answers a critical question:
Are our marketing efforts helping the business achieve its goals?
For example, if your goal is to generate more customers, tracking customer acquisition cost or conversion rate provides useful insight because both metrics directly affect customer growth.
If your goal is to increase profitability, measuring return on marketing investment (ROMI) can help determine whether your campaigns are generating more revenue than they cost.
A good KPI doesn’t just describe what’s happening.
It helps you make decisions.
Also Read: 10 Best Advertising Campaigns of All Time in Nigeria
What Makes a KPI Valuable?
Not every marketing metric qualifies as a KPI.
A valuable KPI typically has four characteristics:
1. It Aligns With Business Goals
Every KPI should connect to a broader business objective.
For example:
| Business Goal | Relevant KPI |
| Generate more leads | Marketing Qualified Leads (MQLs) |
| Acquire more customers | Customer Acquisition Cost (CAC) |
| Increase revenue | Return on Marketing Investment (ROMI) |
| Improve retention | Customer Retention Rate |
If a metric doesn’t help measure progress toward a business goal, it’s probably not a KPI.
2. It’s Actionable
A useful KPI helps guide decisions.
Suppose your conversion rate drops by 30%.
That insight immediately prompts investigation:
- Is the landing page underperforming?
- Has traffic quality declined?
- Is there friction in the checkout process?
The KPI creates a path toward action.
3. It’s Consistently Measurable
A KPI should be easy to track over time using reliable data sources.
Consistency allows marketers to identify trends, compare periods, and evaluate the impact of changes.
4. It Influences Business Outcomes
The best KPIs have a clear relationship with growth, profitability, or customer value.
Metrics that don’t influence outcomes may be interesting, but they shouldn’t dominate your reporting.
Also Read: 7 Steps on How to Measure Marketing Success
KPI vs. Metric: What’s the Difference?
Many marketers use the terms “KPI” and “metric” interchangeably.
They’re related, but they’re not the same thing.
A metric is any measurable piece of data.
A KPI is a metric that directly measures progress toward a business objective.
Here’s a simple way to think about it:
| Metric | KPI |
| Website traffic | Lead Conversion Rate |
| Social media followers | Customer Acquisition Cost |
| Email open rate | Return on Marketing Investment |
| Page views | Customer Lifetime Value |
For example, website traffic is a useful metric.
But traffic alone doesn’t tell you whether your marketing is successful.
You can double your website traffic and still generate zero additional customers.
A conversion rate, on the other hand, directly reflects how effectively visitors are becoming leads or customers.
That’s why it qualifies as a KPI.
The distinction matters because many marketing teams focus too heavily on metrics that are easy to measure and not enough on metrics that drive business decisions.
One marketer in a Reddit community offered a useful way to think about this distinction. They recommended separating reporting into primary KPIs and supporting metrics.
In their view, a primary KPI acts like a high-level indicator of success, while supporting metrics provide context and explain why performance is changing. This approach helps prevent dashboards from becoming overloaded with numbers while still giving marketers enough information to optimize campaigns effectively.
Also Read: How to Use AI for Marketing Your Business in Nigeria
Why Tracking the Right Marketing KPIs Is Important
The purpose of marketing measurement isn’t reporting.
It’s an improvement.
When marketers focus on the right KPIs, they gain clarity about what’s working, what’s underperforming, and where resources should be invested.
Here are four reasons why KPI tracking is essential.
Better Budget Allocation
Every marketing budget has limits.
Whether you’re spending N1,000,000 or N10,000,000 per month, resources need to be allocated carefully.
KPIs help identify which channels deliver the highest return.
For example:
- Paid search may generate customers at a CAC of $50.
- Social media advertising may generate customers at a CAC of $120.
Without KPI tracking, both channels might appear equally successful.
With KPI tracking, it’s obvious which channel deserves more investment.
Stronger Marketing ROI
One of the biggest challenges marketing teams face is proving their impact.
Your leadership doesn’t want to know how many blog posts were published.
They want to know whether those blog posts generated leads, customers, and revenue.
KPIs help connect marketing activities to business outcomes, making it easier to demonstrate value.
Faster Optimization
Marketing performance rarely improves by accident.
Growth comes from continuous testing, learning, and optimization.
KPIs provide the feedback loop necessary to make informed improvements when:
- Conversion rates decline, prompting marketers to investigate.
- Acquisition costs rise, and campaigns can be adjusted.
- Retention improves, and successful strategies can be expanded.
Better Alignment Between Marketing and Business Goals
One of the most common causes of marketing underperformance is misalignment.
Marketing teams focus on engagement.
Leadership focuses on revenue.
Sales focuses on the pipeline.
KPIs create a shared language that keeps everyone focused on the same outcomes.
Also Read: How to Advertise Your Business Online in Nigeria
How to Choose the Right Marketing KPIs
Before we go into the 8 KPIs, there’s a mistake you must avoid:
Don’t pick KPIs because they are popular. Pick them because they reflect your funnel reality.
A user in a Reddit community mentions that one of the biggest mistakes marketers make is choosing KPIs before defining goals. KPIs are indicators of progress, not the goal itself. A metric only becomes valuable when it clearly connects to a business objective and helps guide decisions
Step 1: Define the business objective clearly
Every KPI must connect to one of these:
- Acquire customers
- Increase revenue
- Reduce acquisition cost
- Improve retention
If it doesn’t connect to one of these, remove it.
Step 2: Map KPIs to the customer journey
Marketing performance behaves differently at each stage.
Awareness Stage
People don’t know you yet.
Track:
- Organic traffic
- Reach
- Branded search growth
Consideration Stage
People are evaluating.
Track:
- MQLs
- Email signups
- Engagement depth (not likes)
Conversion Stage
People are deciding.
Track:
- Conversion rate
- CAC
- Lead-to-customer rate
Retention Stage
People have already bought.
Track:
- CLV
- Retention rate
- Repeat purchase rate
Step 3: Limit your system
A strong marketing system is not complex.
It is controlled.
5–10 KPIs are enough.
Anything more becomes noise.
Interestingly, this idea came up repeatedly in a Reddit discussion among B2B marketers about KPI selection. One marketer explained that their team never chooses KPIs first. Instead, they define business goals, decide on the marketing tactics that support those goals, and only then select KPIs to measure progress.
As they pointed out, KPIs are indicators, not objectives. When teams start optimizing for the KPI itself rather than the business outcome behind it, they often end up measuring activity instead of meaningful results.
Also Read: How to Generate Leads for Your Business in Nigeria
8 Marketing KPIs That Actually Matter
Now we go into the real performance system.
1. Customer Acquisition Cost (CAC)
Before I look at any other marketing metric, I start here.
CAC tells me something most marketers avoid asking directly:
Am I actually paying too much to get a customer?
Because growth that looks good on the surface can still be expensive underneath.
You might be getting more traffic, more leads, and more attention.
But if each customer costs more to acquire than they are worth, the system is already broken.
Customer Acquisition Cost is the cleanest way to measure marketing efficiency.
It strips everything down to one question:
How much money do I spend to get one paying customer?
Formula
CAC = Total Marketing + Sales Spend ÷ Number of New Customers
Example (Naira)
Ads spend: ₦2,000,000
Sales tools + salaries: ₦1,000,000
New customers: 300
CAC = ₦3,000,000 ÷ 300 = ₦10,000
At first glance, ₦10,000 may feel acceptable or expensive depending on the business.
But CAC on its own is never the full story.
Why CAC is Critical
I treat CAC as a reality check.
It tells me whether growth is sustainable or just artificially supported by spending.
If CAC increases faster than revenue per customer, the business starts to lose control of its growth engine.
This is where many marketing strategies quietly fail.
They scale traffic instead of scaling efficiency.
They chase volume instead of profitability.
And over time, they end up spending more to earn less.
What a good CAC Looks Like
There is no universal “good” CAC.
What matters is the relationship between CAC and Customer Lifetime Value (CLV).
- If CAC is ₦10,000 and CLV is ₦30,000, the system is stable.
- If CAC is ₦10,000 and CLV is ₦12,000, the system is fragile.
- If CAC is ₦10,000 and CLV is lower, the model is already negative.
CAC never makes sense in isolation.
It only makes sense when compared to long-term customer value.
Common Mistakes
- Ignoring hidden costs
Most teams only count ad spend and assume that it is the full cost.
But real acquisition includes:
- Staff salaries
- Software tools
- Agency fees
- Freelancers
- Sales overhead
When these are ignored, CAC looks lower than reality.
That creates false confidence in scaling.
- Optimizing CAC without looking at quality
Lower CAC does not always mean better performance.
Sometimes, cheaper customers are:
- Less loyal
- Lower spending
- Higher churn
This creates a dangerous illusion of efficiency.
You think you are improving marketing, but you are actually reducing long-term revenue.
How to Reduce CAC
The goal is not just to cut costs. It is to improve efficiency without damaging customer quality.
I focus on:
- Improving targeting accuracy so ads reach the right people
- Prioritizing channels that consistently convert into paying customers
- Improving landing page clarity so more visitors take action
- Building referral systems that lower paid acquisition pressure
- Cutting campaigns that spend money without a clear return
CAC improves when waste is removed, not when effort is increased.
The mistake is trying to grow faster without fixing how efficiently growth is being bought
2. Customer Lifetime Value (CLV)
If CAC tells me how much I spend to get a customer, CLV tells me something more important:
How much that customer is actually worth over time.
Most marketing problems don’t start with acquisition.
They start with a misunderstanding of value.
Because when you don’t know how much a customer is worth, you can’t tell if your marketing is profitable or dangerous.
CLV gives me that clarity.
It answers one simple question:
How much total revenue does one customer bring into the business before they stop buying?
Formula
CLV = Average Purchase Value × Purchase Frequency × Customer Lifespan
For example, if:
- Average purchase = ₦20,000
- Frequency = 3 times per year
- Lifespan = 4 years
So, CLV = ₦20,000 × 3 × 4 = ₦240,000
At first, ₦240,000 can feel abstract.
But it becomes powerful when compared to CAC.
Why CLV Matters
I use CLV to set the limits of growth.
Because it tells me how far I can go with acquisition before the numbers stop making sense.
If CAC is ₦15,000 and CLV is ₦240,000, I know the business has space to scale safely.
But if CLV is low, even a cheap acquisition becomes risky.
This is where many marketing strategies fail quietly.
They focus on lowering CAC without understanding the ceiling created by CLV.
CLV-to-CAC ratio
The best insight comes when you compare both metrics.
- 1:1 → you are breaking even or losing money
- 2:1 → the system is unstable
- 3:1 → the business is healthy
- 5:1+ → strong and scalable growth model
This ratio is what I rely on to understand whether marketing is actually working or just creating activity.
How to increase CLV
Once CLV is clear, the next step is improving it deliberately.
- Improve retention experience: If customers stay longer, CLV increases without extra acquisition cost.
- Upselling: I focus on introducing higher-value tiers or bundles that increase average spend.
- Increase purchase frequency: I use email, retargeting, and loyalty systems to bring customers back more often.
- Improve product satisfaction: When the experience is strong, customers naturally extend their lifespan with the brand.
CLV is not just a number I track.
It is the foundation for how aggressively I decide to grow.
Because without understanding value over time, acquisition decisions become guesswork
Also Read: GEO: How Businesses in Nigeria Can Get Found by AI in 2026
3. Conversion Rate
At this stage, I stop looking at how much traffic a business gets and start asking a harder question:
What happens after people arrive?
Because traffic by itself is not growth.
It is only potential.
Conversion rate tells me how much of that potential actually turns into paying customers.
It answers one simple question:
How efficiently does attention become action?
Formula
Conversion Rate = (Conversions ÷ Total Visitors) × 100
For example:
- 20,000 visitors
- 800 customers
- Conversion rate = 4%
On paper, 4% can look stable.
But the real insight is not the number itself.
It is what that number is doing to your revenue.
Why Conversion Rate Matters
I treat conversion rate as a force multiplier.
Because it determines how much value I extract from every visitor I already paid for or earned.
If traffic costs money, then low conversion means wasted spend.
And even small improvements change everything.
A 1% increase in conversion can outperform months of additional ad spend, because it improves the efficiency of the entire system, not just volume.
This is why I focus on conversion before scaling traffic.
Scaling broken conversion only increases losses faster.
What kills conversion rates
When I audit landing pages or funnels, I usually find the same issues repeating.
- Weak messaging: People land on a page and still don’t understand what is being offered or why it matters.
- Poor trust signals: No reviews, no proof, and no visible credibility. People hesitate when there is no reassurance.
- Slow pages: Even a short delay of 2 to 3 seconds reduces intent. People leave before they even understand the offer.
- Complicated flows: Too many steps between interest and action. Every extra step increases drop-off.
How to Improve Conversion Rate
The goal is not to add more features.
It is to remove friction and make decisions easier.
- Simplify pages so the value is clear in seconds
- Add testimonials and real proof so people trust what they see
- Clarify the value proposition, so there is no confusion
- Improve CTA clarity so the next step feels obvious
- Run continuous A/B tests so decisions are based on behavior, not opinions
Conversion rate is where most marketing systems either become efficient or wasteful.
Because once traffic is inside the system, this is where you either earn the value or lose it.
Also Read: 15 Marketing Ideas for Small Nigerian Businesses [Examples Included]
4. Marketing Qualified Leads (MQLs)
Not every lead deserves the same attention.
Some people are simply exploring. Others are actively looking for a solution.
The challenge is knowing the difference.
That is why I pay close attention to Marketing Qualified Leads (MQLs).
Because lead volume alone does not tell me whether marketing is working.
A dashboard full of leads can look impressive. But if those leads are not moving toward a purchase, the numbers create a false sense of progress.
MQLs help me identify the leads that matter most.
- The people who are showing real interest.
- The people who are moving closer to a decision.
- And the people who are most likely to become customers.
Here is what MQLs can look like in practice:
Downloading a pricing guide: Someone who views pricing information is often evaluating options, not just learning about a topic.
A software company may offer a detailed pricing guide in exchange for contact information. When prospects download it, they reveal a stronger level of interest than someone reading a blog post.
Requesting a demo: This is one of the strongest buying signals because the lead wants to see how the product works before making a decision.
Many SaaS companies use demo requests as a key qualification point because it shows direct product interest.
Visiting product pages repeatedly: One visit may be curiosity. Multiple visits often indicate active research.
An interested buyer may return several times to compare features, pricing, or implementation details before taking the next step.
Engaging with multiple emails: Consistent interaction often signals growing interest.
Instead of opening one email and disappearing, qualified leads continue engaging with educational content, case studies, and product updates.
These behaviors matter because they show intent.
Intent is what separates a potential customer from a casual visitor.
Without that distinction, it becomes easy to overestimate marketing performance.
I have seen businesses generate large numbers of leads while sales remain unchanged.
The problem usually is not lead generation.
It is a lead qualification.
That is where MQLs create clarity.
They help marketing and sales focus on the people who are most likely to convert.
This focus on lead quality over lead volume is something many experienced marketers emphasize. In a Reddit discussion about marketing measurement, several practitioners noted that large lead numbers can create the illusion of success when those leads rarely become customers.
Instead, they argued that behaviors such as requesting a demo, visiting pricing pages, attending webinars, or repeatedly engaging with product content are often stronger indicators of future revenue than lead volume alone.
So, ask:
- Are my leads showing buying signals or just browsing?
- Do marketing and sales agree on what qualifies as an MQL?
- Am I measuring lead quality or only lead quantity?
- Which actions indicate genuine purchase intent?
- Do my highest-converting customers share common behaviors before they buy?
Once you define what qualifies as an MQL, you can build a system that prioritizes quality over volume. That makes it easier to allocate resources, improve conversion rates, and create a healthier path from lead generation to revenue.
Also Read: 7 Ways to Find Related Content Ideas Beyond SEO Tools
5. Lead-to-Customer Conversion Rate
Generating leads feels like progress.
- More form submissions.
- More signups.
- More names entering the pipeline.
But none of that automatically creates revenue.
This is where many businesses get stuck.
They celebrate lead growth while ignoring a more important question:
How many of those leads actually become paying customers?
This step is about measuring what happens after the lead is captured.
Lead-to-customer conversion rate shows whether interest is turning into actual business.
It helps you understand if the people entering your funnel are the right fit and whether your sales process is converting opportunities into revenue.
This matters because growth does not come from leads alone.
It comes from customers.
A marketer participating in a Reddit discussion made a similar observation, arguing that many companies celebrate growing lead counts without examining whether those leads ultimately convert into revenue.
According to their experience, increasing lead volume while customer growth remains flat is often a sign of deeper issues such as poor lead qualification, weak follow-up processes, or misalignment between marketing and sales.
And when conversion rates are low, the problem is often bigger than marketing. It can point to weak lead qualification, slow follow-ups, poor sales conversations, or misalignment between what marketing promises and what sales delivers.
So, how do you measure whether your funnel is truly creating customers?
Start by calculating your lead-to-customer conversion rate and analyzing what happens between first interest and final purchase.
If you measure this KPI well, you’ll quickly see whether your growth system is creating customers or quietly losing them.
Many businesses generate a healthy number of leads but struggle to turn that interest into revenue.
On the surface, lead generation appears to be working.
But a closer look often reveals that too many prospects are dropping out before becoming customers.
That’s exactly what this KPI helps uncover.
At the end of this, you should be able to say:
- How many leads become customers
- Where conversion opportunities are being lost
- What needs to improve between marketing and sales to increase revenue
Also Read: How To Use Reddit For Niche SEO Keyword Research
6. Return on Marketing Investment (ROMI)
Marketing performance only matters if it produces a return.
It is easy to get distracted by campaign activity, growing traffic, or increasing engagement.
But none of those automatically mean the business is making money.
Before calculating ROMI, do a quick financial review:
- How much revenue did marketing help generate?
- How much was spent to achieve that result?
- Can revenue be accurately linked back to marketing efforts?
- Are there channels consuming the budget without delivering returns?
You can use the Marketing Performance Dashboard to track revenue and marketing spend:
Once the numbers are clear, calculate ROMI using a simple formula:
- Revenue: Total revenue generated from marketing efforts
- Marketing Cost: Total amount invested in marketing
- ROMI: Financial return generated from marketing spend
Revenue, Marketing Cost, Return on Marketing Investment
Lastly, avoid evaluating marketing channels in isolation. Campaign performance, conversion rates, customer acquisition costs, retention, and attribution data should all contribute to the ROMI calculation. Each metric provides context, but ROMI reveals whether the entire system is creating value.
Connecting performance metrics to financial outcomes gives marketing a stronger business focus.
At the end, your marketing results should feel measurable, not assumed.
Also Read: How to Rank Your Business for ‘Near Me’ Searches” in Nigeria
7. Organic Traffic Growth
I stop looking at organic traffic as a vague “SEO result” and start treating it as something measurable and directional:
Is search visibility actually improving in a way that leads to business growth?
Because without proper tracking, organic traffic becomes guesswork.
You might see more visits and assume things are working.
But you won’t know if rankings are improving, if the right keywords are growing, or if traffic is converting.
That’s where Semrush becomes useful.
Semrush helps me move from assumptions to actual visibility data.
Organic traffic growth measures how much consistent, search-driven growth a business earns over time.
It answers one simple question:
Are we becoming easier to find for the problems we solve?
Why it Matters
I treat organic traffic as a compounding asset.
Unlike ads, it does not reset when you stop spending.
But only if it is measured properly.
Without tracking, you cannot tell whether you are building momentum or just publishing content into silence.
With Semrush, I can see whether growth is real or cosmetic.
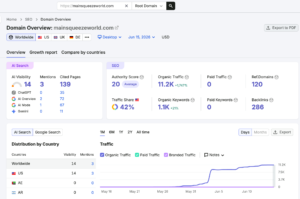
It shows keyword movement, traffic estimates, and ranking changes that reflect actual progress, not just surface-level analytics.
What matters inside organic traffic
Not all organic traffic signals matter equally.
This distinction between traffic and business impact was highlighted by one marketer in a Reddit community who shared an experience where a website generated significant organic traffic but very few conversions.
After investigating, they discovered that the content was ranking for a high-volume keyword that attracted the wrong audience entirely. The lesson was simple: traffic growth only matters when it brings in visitors who are genuinely likely to become leads or customers.
I focus on the parts that connect directly to demand and conversions
They are:
- Non-branded keywords: These show whether you are reaching new people who do not already know your brand.
- Ranking growth: This shows if your content is gaining authority and visibility over time.
- Click-through rate: Ranking alone is not enough. I check whether people actually choose to click.
- Conversions from search: This is the final filter. Traffic only matters if it turns into leads or customers.
Semrush helps me connect all of this in one place, so I am not switching between guesswork and scattered dashboards.
How to Grow Your Organic Traffic
Organic growth is not random. It is built through consistent execution and feedback loops.
- Publish problem-solving content: I focus on content that directly matches real search intent, not general topics.
- Optimize technical SEO: Site structure, speed, and indexing all affect how search engines rank content.
- Build authority links: Backlinks still act as trust signals that improve visibility.
- Update old content regularly: I improve existing pages instead of only creating new ones, because updates often move rankings faster.
When I use Semrush here, I am not just tracking performance.
I’m using Semrush as a feedback system to see what is working, what is improving, and where content is losing visibility.
Organic traffic only becomes valuable when it is measurable, repeatable, and improving over time
Also Read: Content Marketing in Africa: What Businesses in Nigeria Should Know
8. Customer Retention Rate
I stop focusing on how many new customers a business is acquiring and start asking a more important question:
How many of those customers actually stay?
Because acquisition without retention is expensive repetition.
You keep paying to replace customers you already had.
Customer retention rate shows whether a business is building long-term relationships or just cycling through one-time buyers.
It answers one simple question:
After people buy once, do they come back?
Formula
Retention = ((End Customers − New Customers) ÷ Start Customers) × 100
Example
- Start: 2,000
- End: 2,400
- New: 600
- Retention = 90%
On paper, 90% looks strong.
But the real insight is not the number itself.
It is what the number says about customer behavior over time.
Why it Matters
I treat retention as the profit multiplier inside a business.
Because keeping customers is always cheaper than acquiring new ones.
When retention improves, every other marketing KPI becomes easier to hit.
- CAC becomes more efficient.
- CLV increases naturally.
- Revenue becomes more predictable.
But when retention is weak, no amount of acquisition fixes the system.
You end up running harder just to stay in place.
That is why I look at retention as a structural signal, not just a performance metric.
It shows whether the product experience is strong enough to hold attention after the first purchase.
What matters inside retention
Retention is not one flat number.
I break it into signals that explain why customers stay or leave.
- Repeat purchase behavior: This shows whether customers see ongoing value, not just a one-time benefit.
- Time between purchases: If gaps keep increasing, engagement is weakening even if sales still happen.
- Churn patterns: I look for when customers leave, not just how many leave.
- Engagement after purchase: Support usage, product interaction, and communication response all matter.
How to Improve Retention
Improving retention is not about constant promotions.
It is about making the post-purchase experience strong enough that customers do not need convincing to stay.
- Better onboarding experience: I make sure customers reach value quickly after buying. Early success reduces drop-off.
- Continuous customer support: Fast and helpful support prevents small issues from becoming cancellations.
- Loyalty programs: I use rewards and incentives to make repeat behavior more natural.
- Consistent value delivery: The product or service must keep solving the same problem better over time.
Retention is where marketing stops being about persuasion.
And starts being about whether the product deserves to keep the customer.
One recurring theme among experienced marketers is the importance of having a clear reporting hierarchy.
In a Reddit discussion about KPI tracking, one contributor suggested that every marketing team should have a single primary KPI tied directly to business performance, supported by a smaller group of secondary metrics that provide context.
The reasoning is straightforward: leadership needs a simple way to understand whether marketing is succeeding, while marketers need deeper metrics to diagnose and improve performance. When every metric becomes a KPI, reporting becomes noise instead of insight.
Build a Marketing System That Drives Revenue
Marketing performance is not something you measure once and forget. It is something you review, improve, and strengthen over time.
You now have a clear framework with:
- Customer-focused metrics
- Cost visibility
- Conversion tracking
- Retention insights
- Revenue-driven reporting
- Clear performance priorities
That clarity makes better decisions easier.
Your next step is simple: review the metrics you’re tracking and identify which ones directly impact revenue.
Remove distractions. Focus on customer acquisition, conversion, retention, and cost efficiency.
You need to remember that you do not need to track everything. You only need to track what helps me understand and improve business growth.
Once you have the right metrics in place, the next logical step is using that data to improve marketing performance.
If you want to make smarter marketing decisions, you should start by building a measurement system that connects marketing activity to revenue.